The Great Pet Divide: Which States (and Cities) Are "Team Dog" or "Team Cat"?
Jul 29, 2026
Sorry, we couldn't find any results matching
Please:
Sorry, we couldn't find any results matching
Please:
Dogs and cats have split the country, and the fault lines follow the map. To chart the divide, Fractl analyzed a year of Google search activity across all 50 states, Washington, D.C., and 55 major U.S. metros on behalf of MetLife. They also surveyed 1,005 adults about the pets they keep and the partners they date. These two datasets show a nation that leans dog overall, but breaks into clear regional camps.
The divide runs deeper than geography. It shows up in how people describe their own personalities and in how far they'll go for a pet, including ending a relationship over one. From the state map to the dinner-table debate, this is where America stands.
Mississippi, Wyoming, and South Carolina are America's most dog-obsessed states, led by Mississippi, where dog-related searches run 120% above cat searches.
Dogs out-search cats in every single state, so no state actually favors cats in raw volume. What the map shows instead is relative lean — how far each state's dog-versus-cat search mix sits above or below the national average. States scoring above zero lean more "dog" than the country overall, and states scoring below zero lean more "cat."
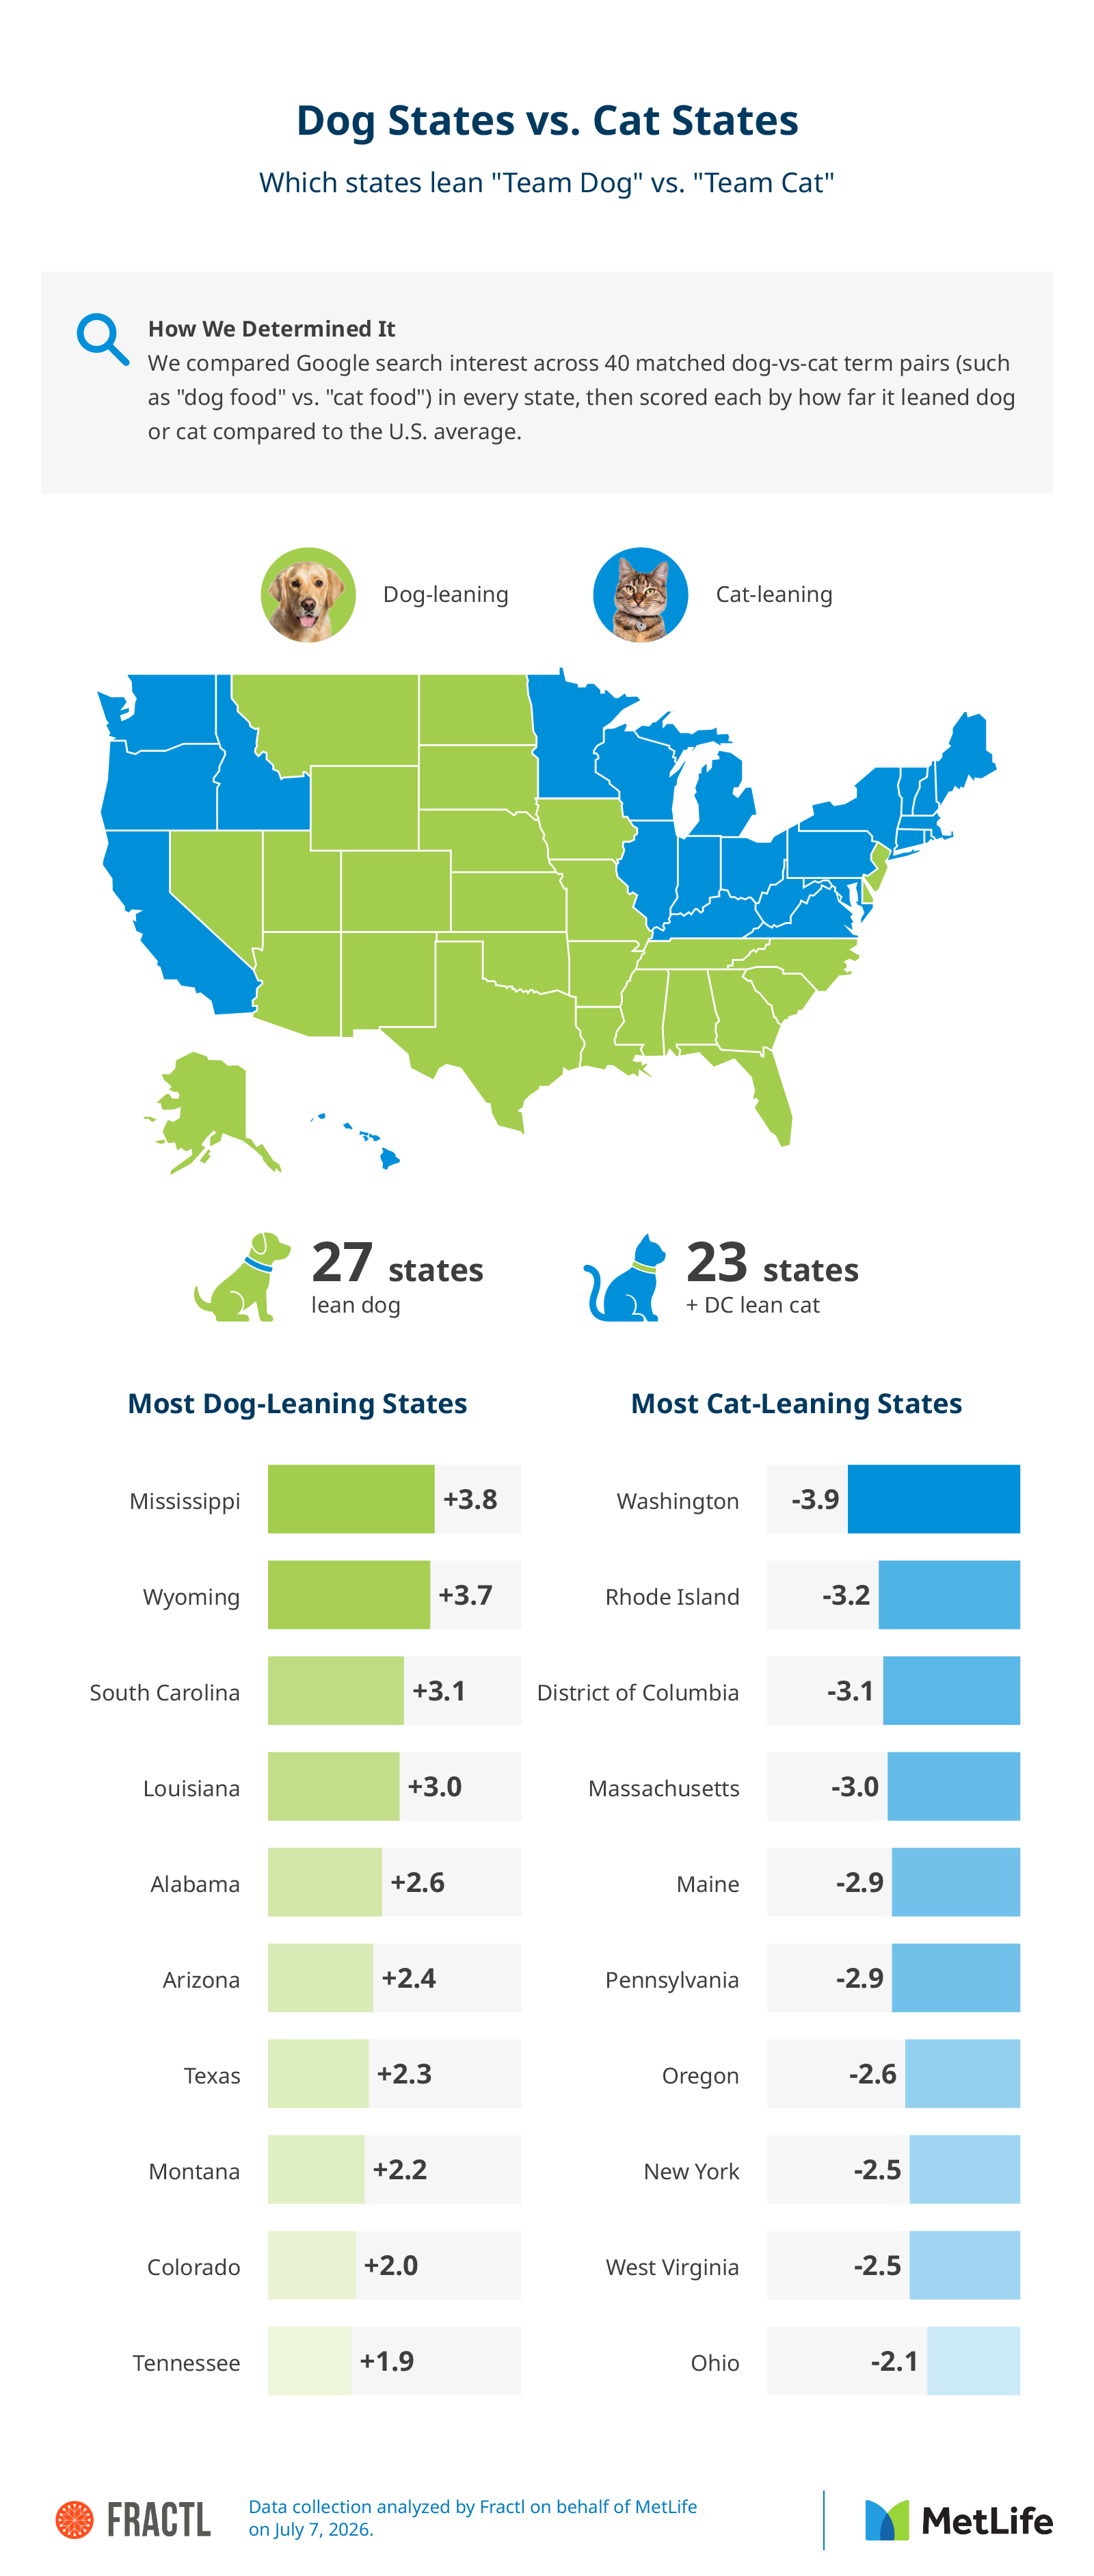
Mississippi is the most dog-obsessed state in the country, where dog-related searches run 120% above cat searches. A dog belt runs through the Deep South and Mountain West, while a cat belt stretches across New England and the Pacific Northwest. Each state's lean index below shows how far its dog-versus-cat search mix runs above or below the national average, with positive scores leaning dog and negative scores leaning cat.
These 10 states lean the most toward dogs:
Washington is the most cat-leaning state, but even there, dog-related searches still run 53% above cat searches. These 10 states and jurisdictions lean the most toward cats:
Overall, the country splits 27 dog-leaning states and 23 cat-leaning states (plus Washington, D.C.). What tips each state varies. Adoption searches like puppy adoption, rescue, and shelters power the strongest dog states. Care searches for food, vets, and grooming, and lifestyle searches for memes and cafes, push several states toward cats.
Zoom into the metros and the split widens, with the most cat-obsessed cities leaning harder than any cat-leaning state.
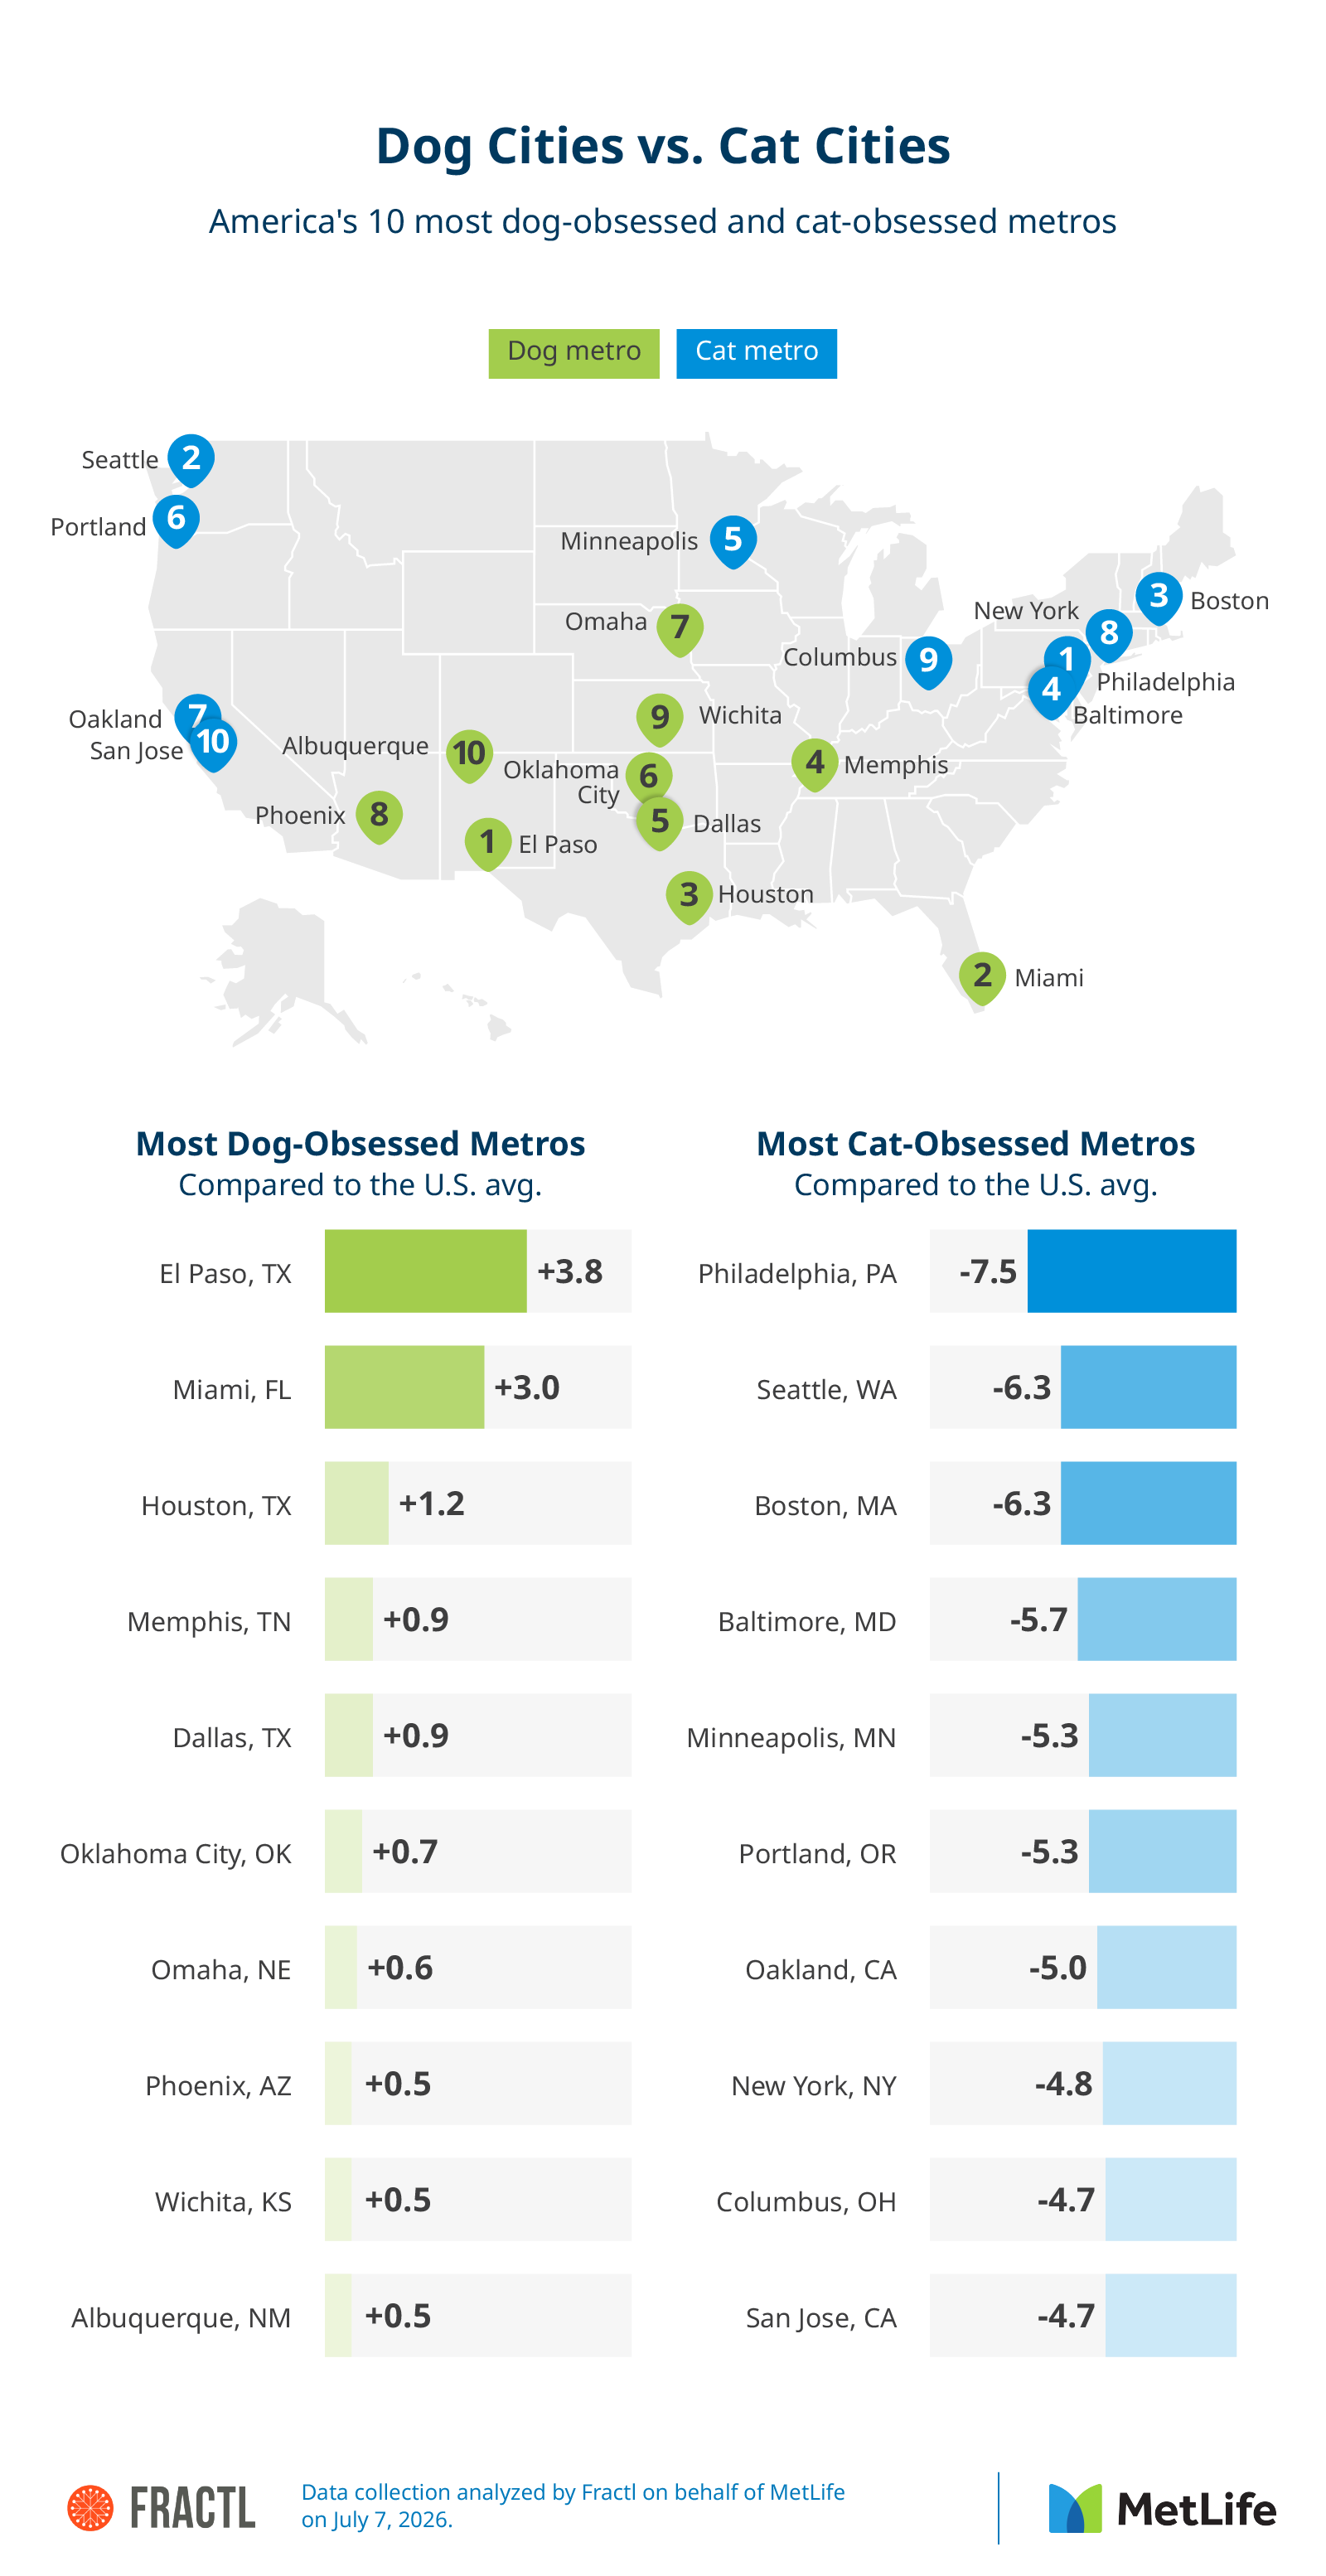
El Paso is the most dog-obsessed metro in the country, with dog-related searches 135% above cat searches. The strongest dog metros cluster across the Sun Belt and South, mirroring the dog belt at the state level.
These 10 metros are the most dog-obsessed in the country:
Philadelphia is the most cat-obsessed metro, and the cat list is dominated by coastal and tech hubs. Cities also polarize more than states. The most cat-obsessed metro leans nearly twice as feline as the most cat-obsessed state, so the divide sharpens in urban America.
And these 10 metros lean the hardest toward cats:
The map shows where dog people and cat people live. The survey shows who they are and what they'd do for their pets when a relationship is on the line.
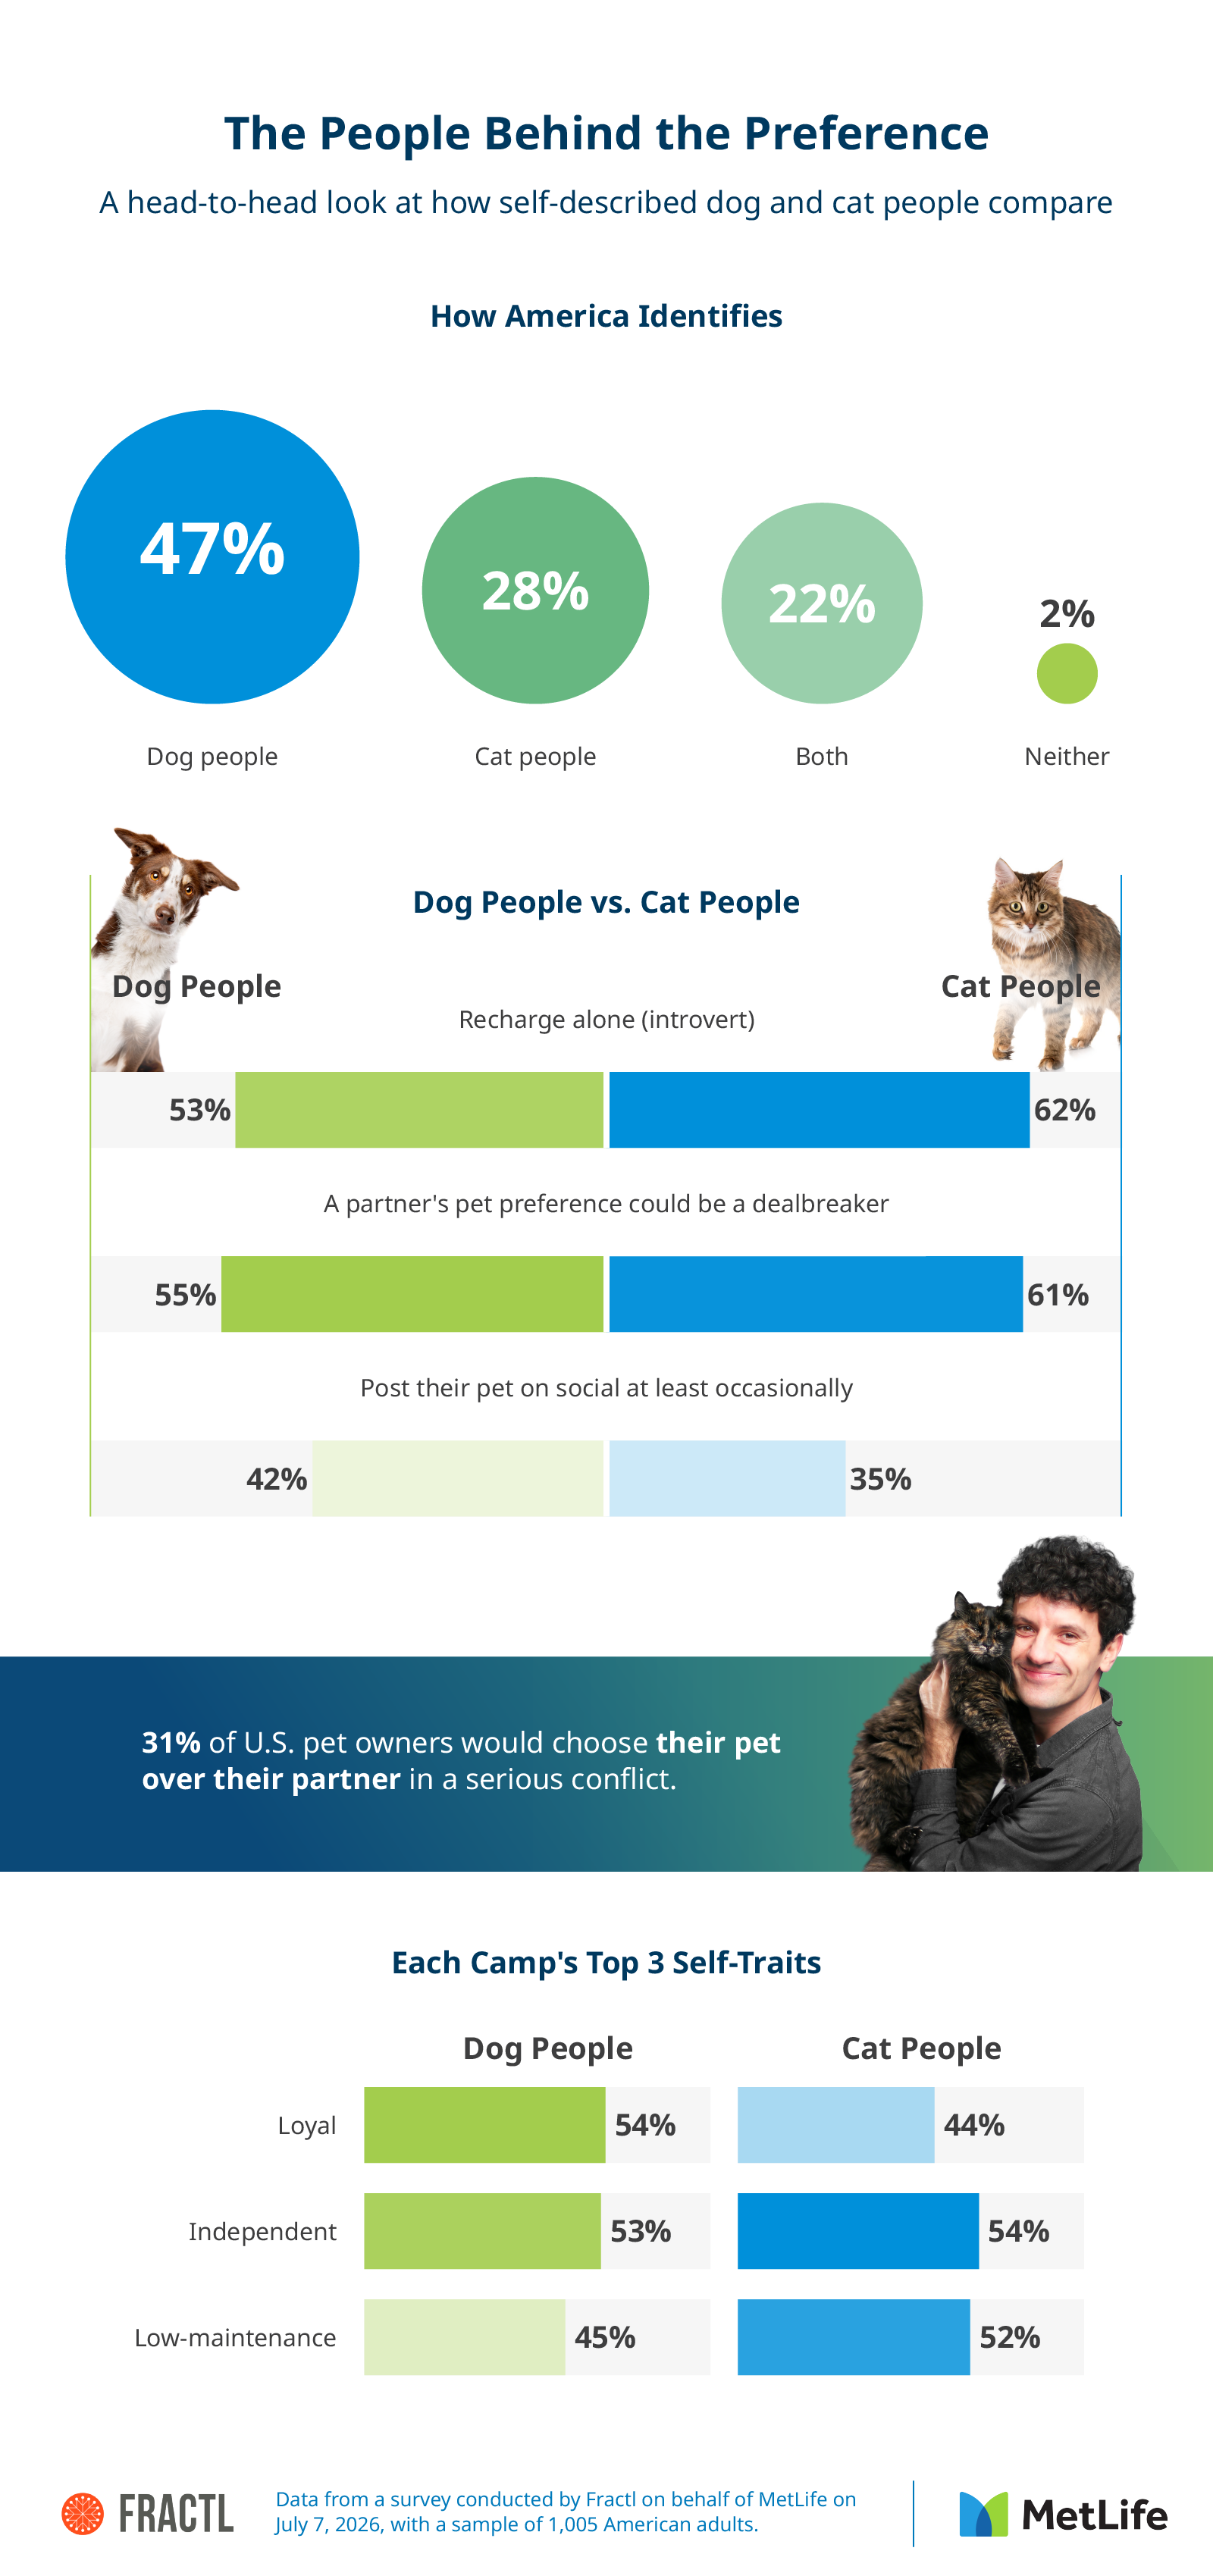
Americans identify as dog people over cat people by nearly 2-to-1 (47% vs. 28%), while 22% claim both and 2% neither. That tilt toward dogs held across every generation, with cat identity staying in a narrow 26% to 29% band regardless of respondent age.
The two camps often, but not always, describe themselves differently. Dog people call themselves loyal (54%) and protective (42%), while cat people lean low-maintenance (52%). Both sides claim independence at nearly the same rate (53% dog vs. 54% cat).
The clearest personality split backs the introverted-cat-person stereotype: 62% of cat people said they recharge alone, compared with 53% of dog people. Among cat people, 21% said cat people are friendlier, and 20% said dog people are friendlier, in a near-tie, while 71% of dog people back their own side.
Pet preference also carries real weight in dating. More than 1 in 2 U.S. adults (57%) say a partner's pet preference could be a dealbreaker, with cat people slightly pickier than dog people (61% vs. 55%), and 18% saying a partner must share their preference, no exceptions.
Loyalty to the animal runs deep, too. Nearly 1 in 3 U.S. pet owners (31%) would choose their pet over their partner in a serious conflict, rising to 35% among those who refuse to pick a side in the dog-versus-cat debate.
Whether the map places you in a dog-loving state like Mississippi or a cat-leaning metro like Philadelphia, the takeaway holds steady. America is a nation of devoted pet owners, and the regional split reveals as much about local culture as it does about personal identity. Yet for all the debate over which side comes out ahead, the affection people feel for their animals crosses every state line. No matter where you land in the great divide, that loyalty is something dog people and cat people share.