Adoption was the most common way pet owners acquired their most recent pet, but several other paths were also common:
- 40% adopted from a shelter or rescue.
- 20% purchased from a breeder.
- 19% received a pet from friends or family.
- 11% found a stray.
- 4% purchased from a pet store.
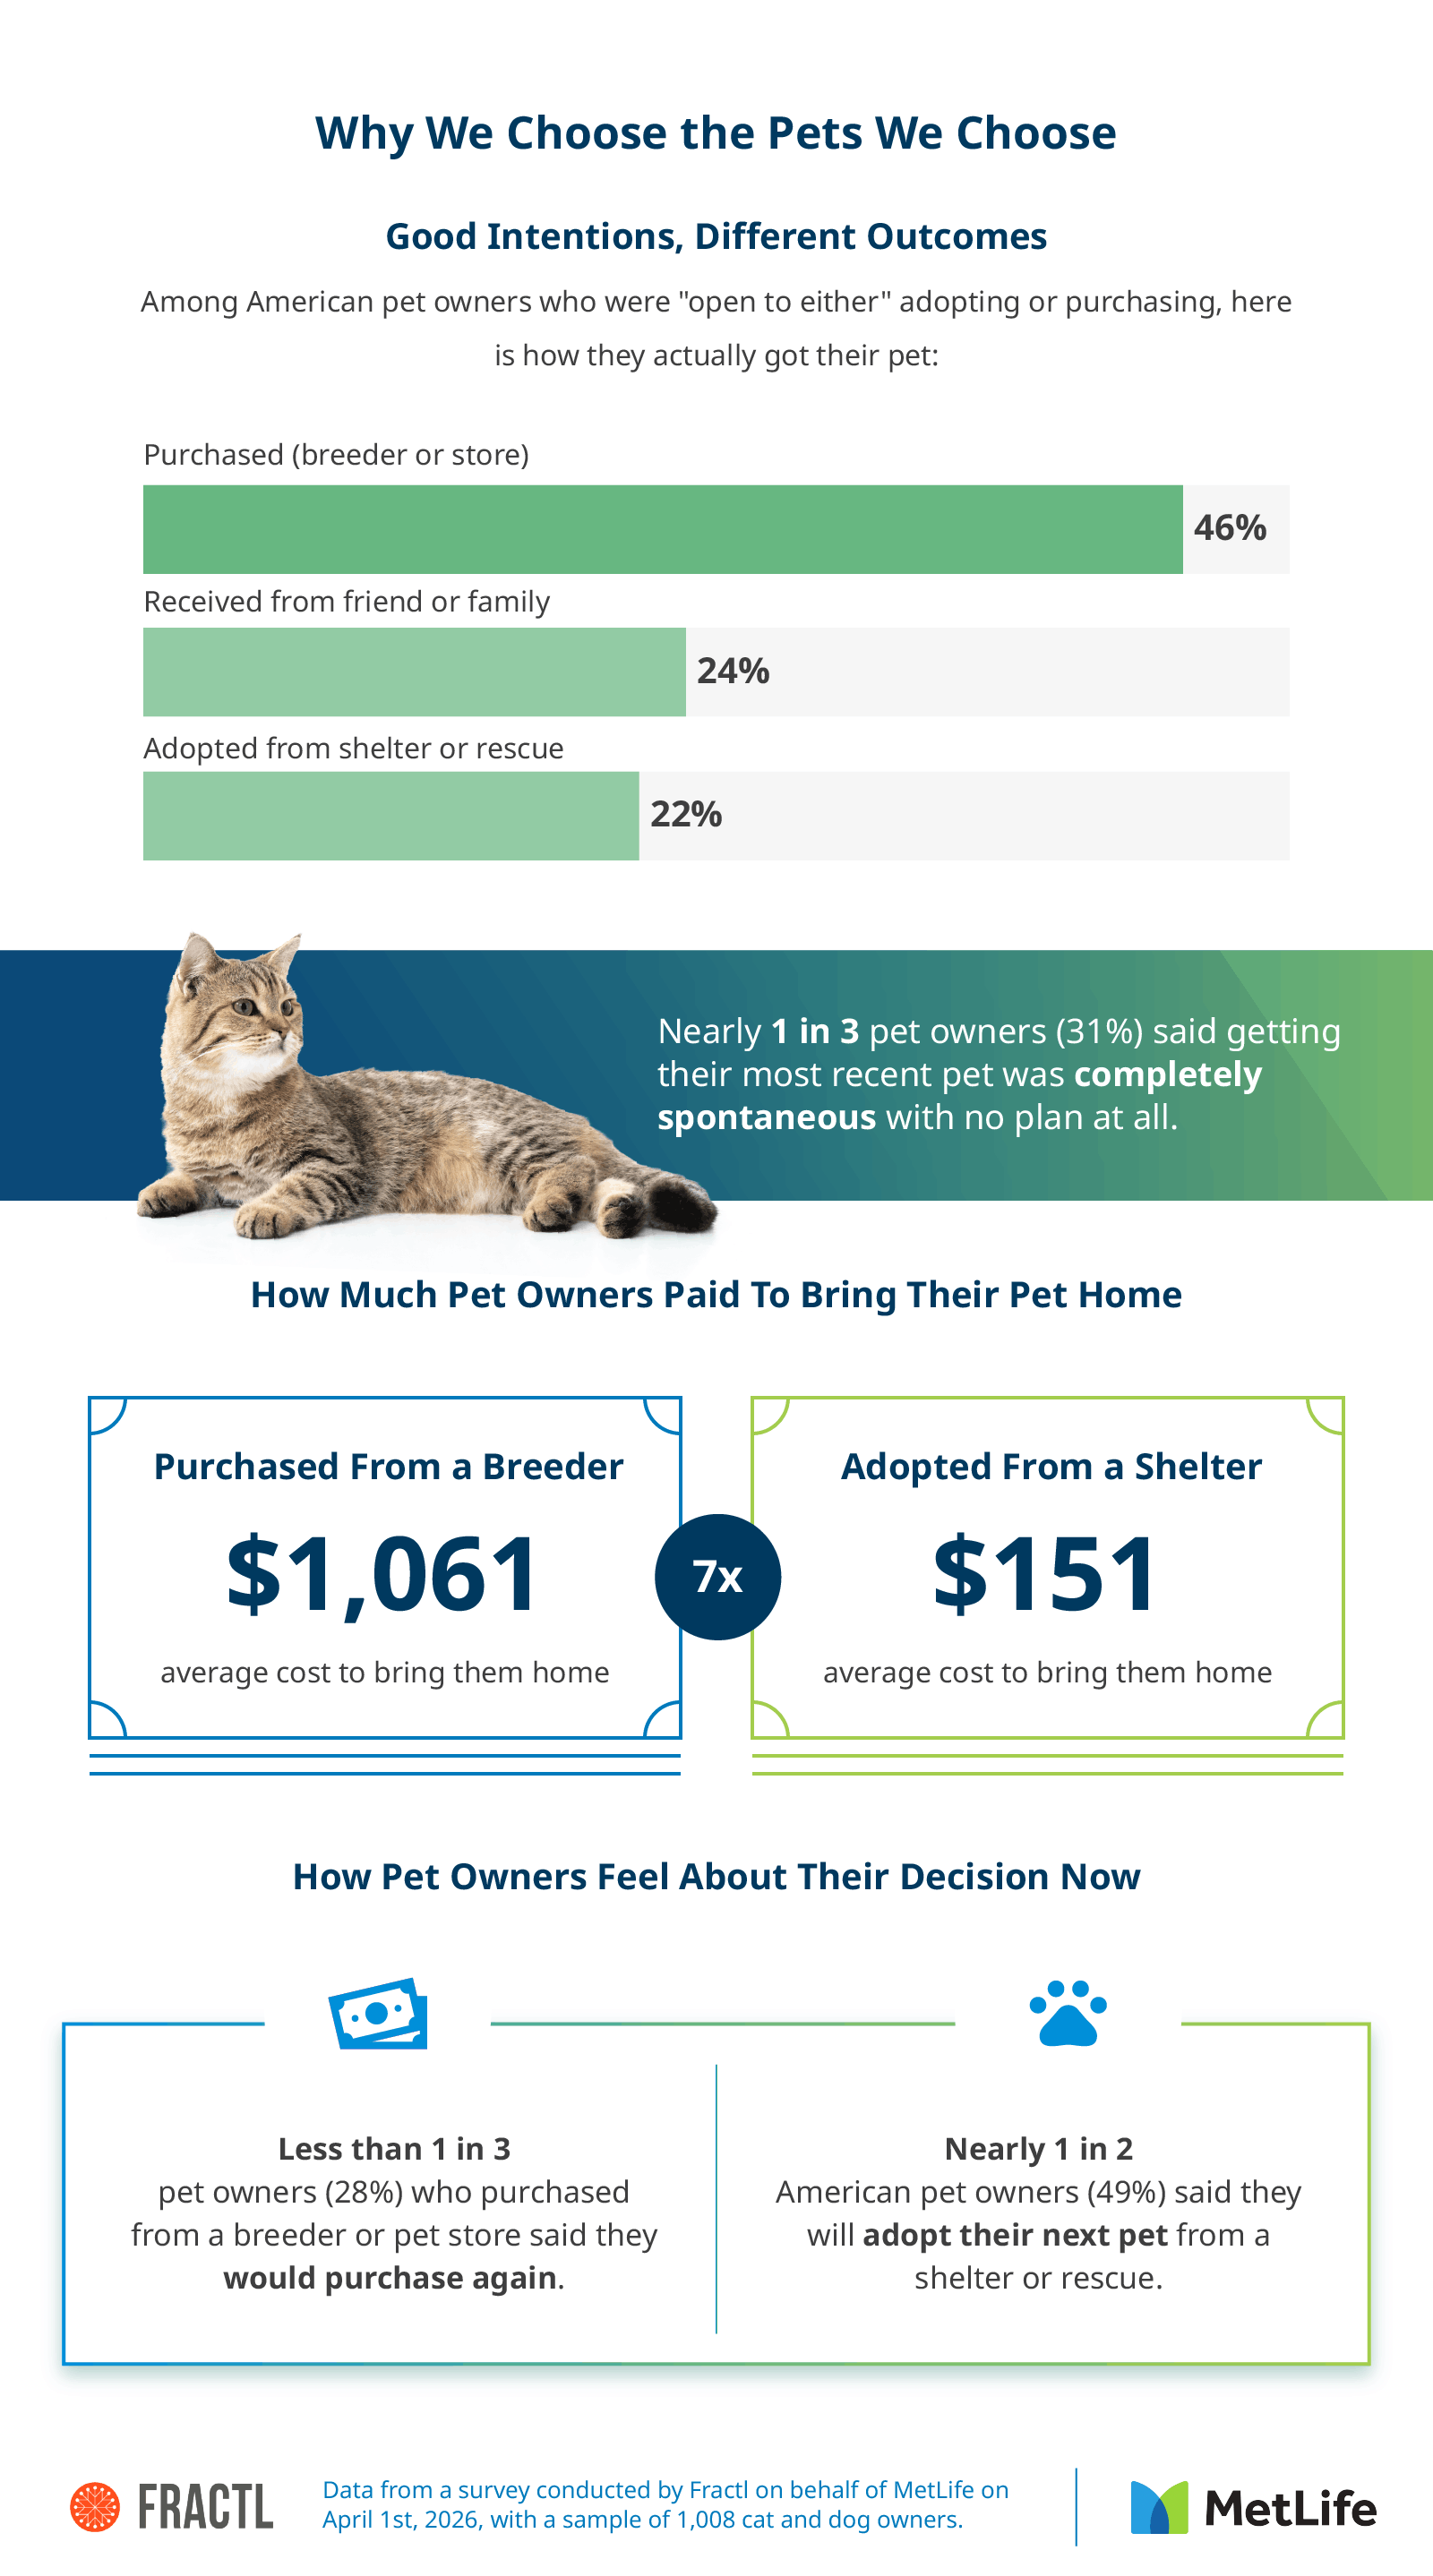
Even among those who were open to either adopting or purchasing, outcomes skewed toward buying. Purchases outpaced adoptions by more than two to one, and millennial pet owners in this group were the most likely to end up purchasing from breeders at 45%.
Generational differences also influenced behavior. Gen X pet owners adopted at the highest rate at 42%, while Gen Z adopted at the lowest rate at 36%. Millennials were the most likely to purchase from breeders at 22%.
Pet owners cited several key factors influencing their decision:
- 33% cited an emotional connection with the animal.
- 21% considered the breed or species availability.
- 17% were influenced by their ethical beliefs.
- 12% chose based on convenience or timing.
- 6% made their decision based on cost.
Among those who purchased from breeders, only 6% cited emotional connection as their primary factor, suggesting a more preference-driven approach.
Spontaneity was also common, with 31% of pet owners saying their most recent pet decision was completely unplanned. Baby boomers reported the highest rate of spontaneous decisions at 40%. These decisions often came with financial implications.
Costs revealed another layer of the experience. Bringing home a pet from a breeder cost $1,061 on average, compared to $151 for adoption. Millennial pet owners reported the highest average acquisition cost at $196, while baby boomers spent $97 on average.
Unexpected expenses were widespread. Nearly 3 in 4 pet owners (73%) experienced at least one surprise cost within the first 90 days, with veterinary bills cited most often (43%). Millennial pet owners reported these unexpected vet costs at the highest rate, at 45%.²
Preparation gaps were also evident. Half of pet owners said they felt well-prepared before getting their pet, while Gen Z reported the lowest preparedness at 44%.
Among those who felt unprepared, here were the most common regrets:
- 34% regretted underestimating the financial cost of ownership.
- 30% were unprepared for the time and attention required.
- 26% didn't anticipate the impact on their social life or travel.
- 26% were caught off guard by the impact on their living situation.
Despite these challenges, only 19% of pet owners reported having pet insurance.³ Gen Z and millennial pet owners were nearly twice as likely to be insured at 22%, compared to 12% of baby boomers. Long-term outcomes reflected these challenges. Over 27% of pet owners said they had rehomed a pet or seriously considered it.
These were the most common reasons:
- 32% reported behavioral issues with their pet.
- 30% experienced significant lifestyle changes.
- 27% found that their pet's needs exceeded their expectations.
Technology and discovery also played a role. Thirteen percent of pet owners said they first discovered their pet's breed through social media, with Gen Z leading at 18%.
Among pet owners who used AI tools for pet decisions:
- 27% said AI tools had no influence on their decision.
- 26% were more likely to purchase a pet as a result.
- 24% kept both buying and adopting as options.
- 23% were more likely to adopt a pet as a result.
Looking ahead, adoption intent remained strong. Nearly half of pet owners said they plan to adopt their next pet, with Gen X leading at 57%. Among those who previously purchased, 17% said they plan to adopt next, while 40% said they are open to either option.
Pet adoption is becoming an increasingly meaningful choice for many Americans, shaped by regional trends, personal experiences, and evolving expectations. While emotional connection continues to guide decisions, practical factors such as cost, preparation, and lifestyle fit also play a critical role in outcomes.
The findings highlight both the opportunities and challenges of pet ownership, especially for first-time pet parents. As adoption interest continues to grow, understanding these patterns can help more families make confident, informed decisions when bringing a pet home.
This survey of 1,008 American cat and dog owners was conducted by Fractl on behalf of MetLife on February 3, 2026, to explore how pet owners decide to adopt or purchase a pet, the costs and surprises they encounter, and how they prepare for ownership. The average age of respondents was 41; 61% were female, 36% were male, and 2% were nonbinary. Generationally, 34% were baby boomers and Gen X combined, 49% were millennials, and 17% were Gen Z.
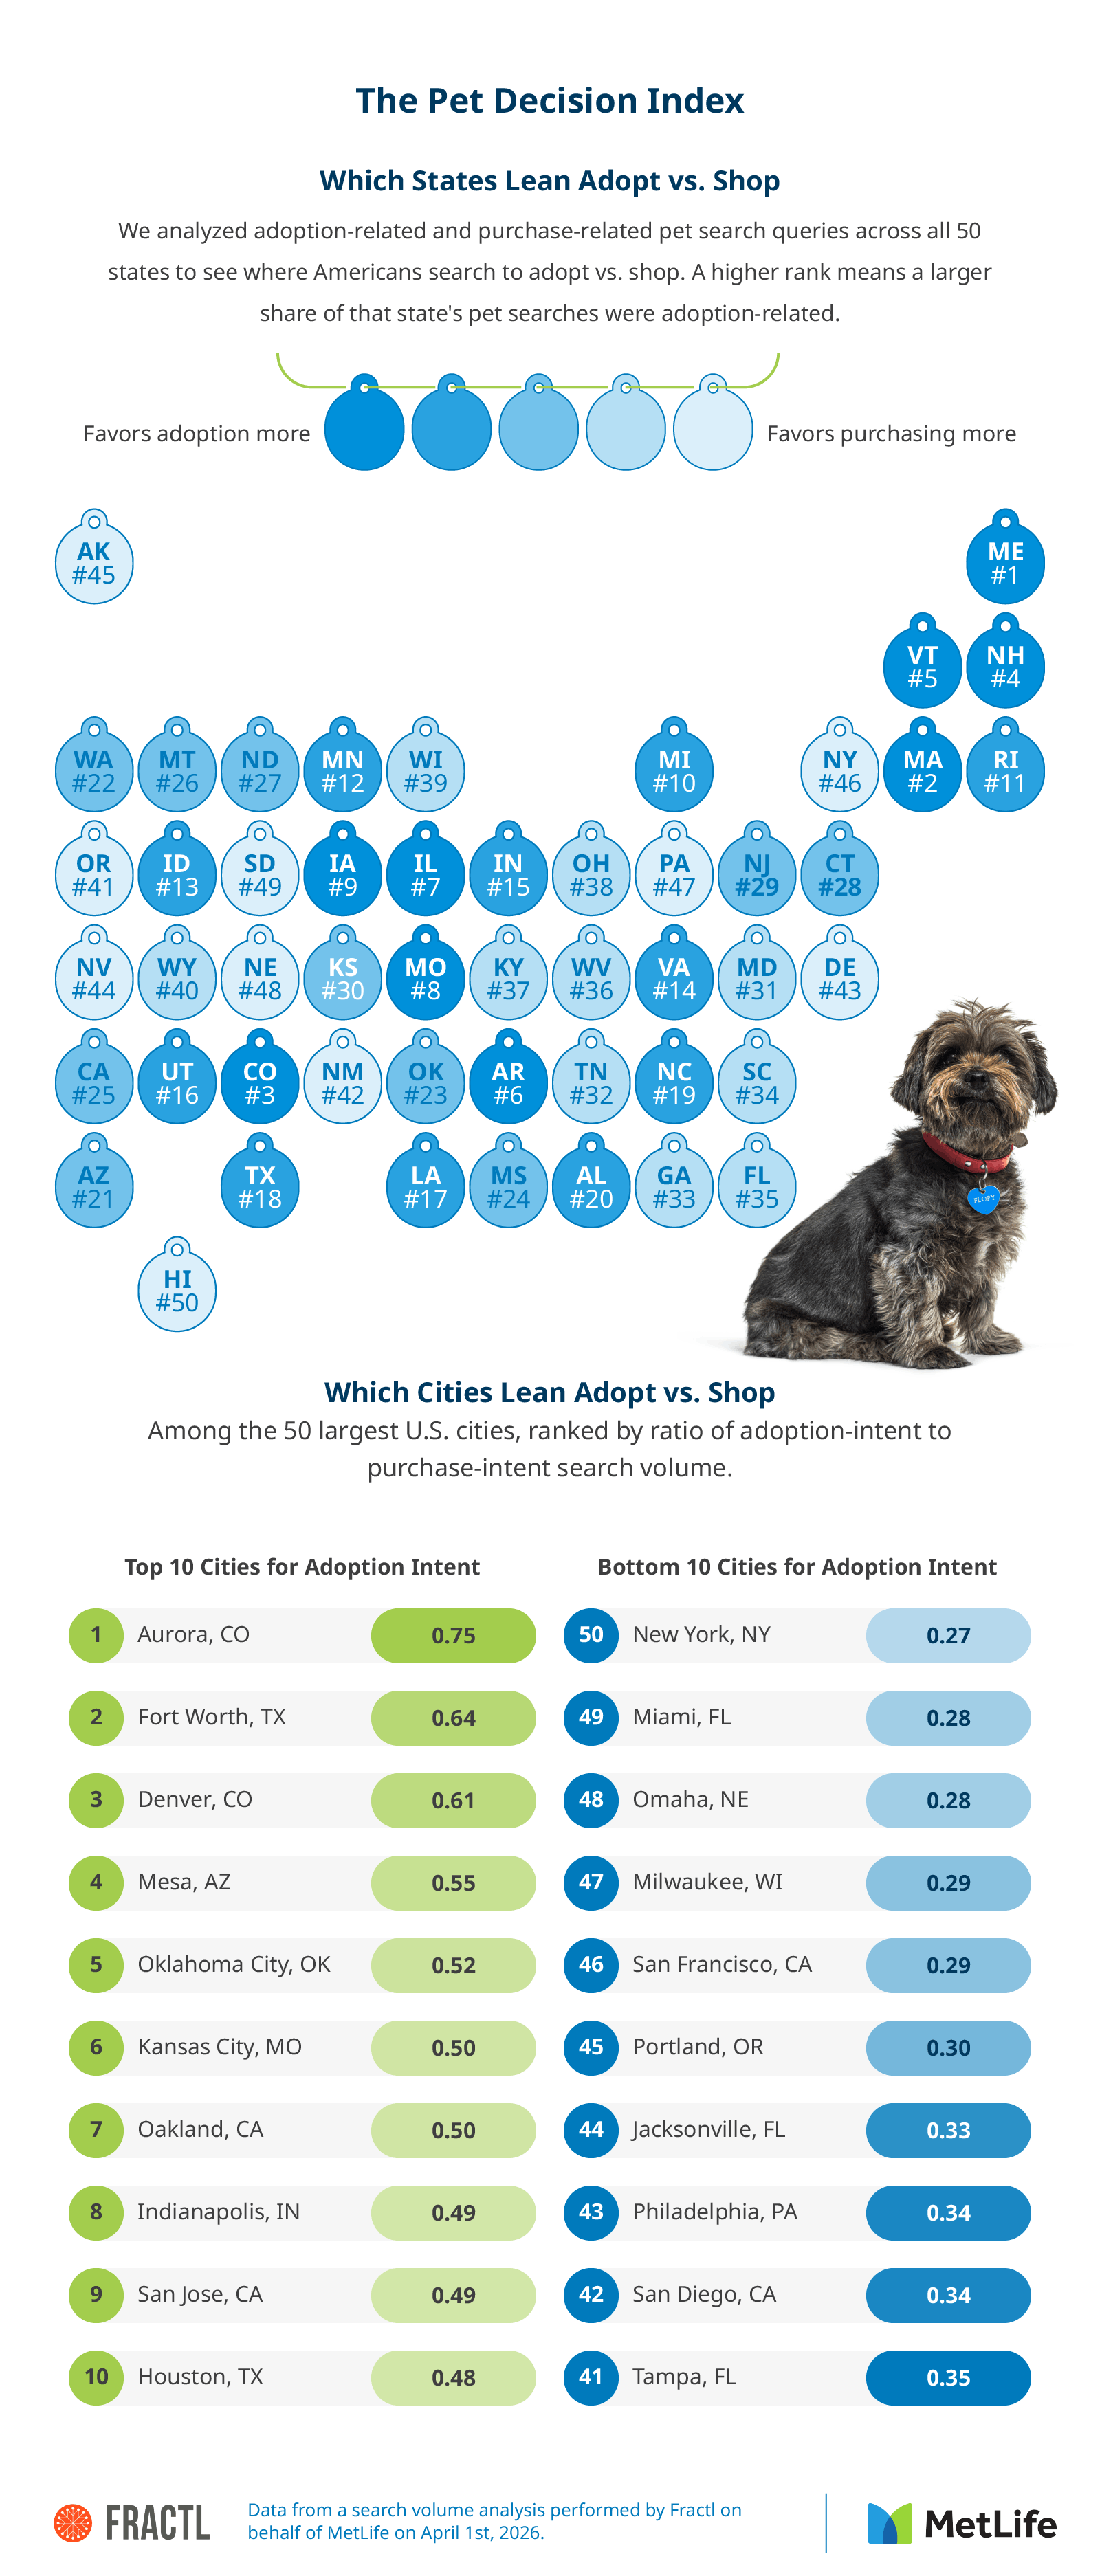
Search volume data was collected for 222 pet-related keywords across all 50 U.S. states and 50 of the largest U.S. cities for the period of 2025-2026. Keywords were categorized as adoption-intent (39 queries, including shelter, rescue, and adoption searches) or purchase-intent (99 queries, including breeder, pet store, and breed-specific purchase searches). The Pet Decision Index ratio was calculated by dividing total adoption-intent search volume by total purchase-intent search volume for each geography.
MetLife Pet Insurance provides comprehensive insurance solutions for pets. Depending on your level of coverage and the plans you choose, we can cover everything from routine checkups to emergency services. Help your pets get the care they need and worry less about the costs with pet insurance from MetLife.
This information may be shared for noncommercial purposes only. If you reference or distribute this content, please include proper attribution and a link back to MetLife Pet Insurance.